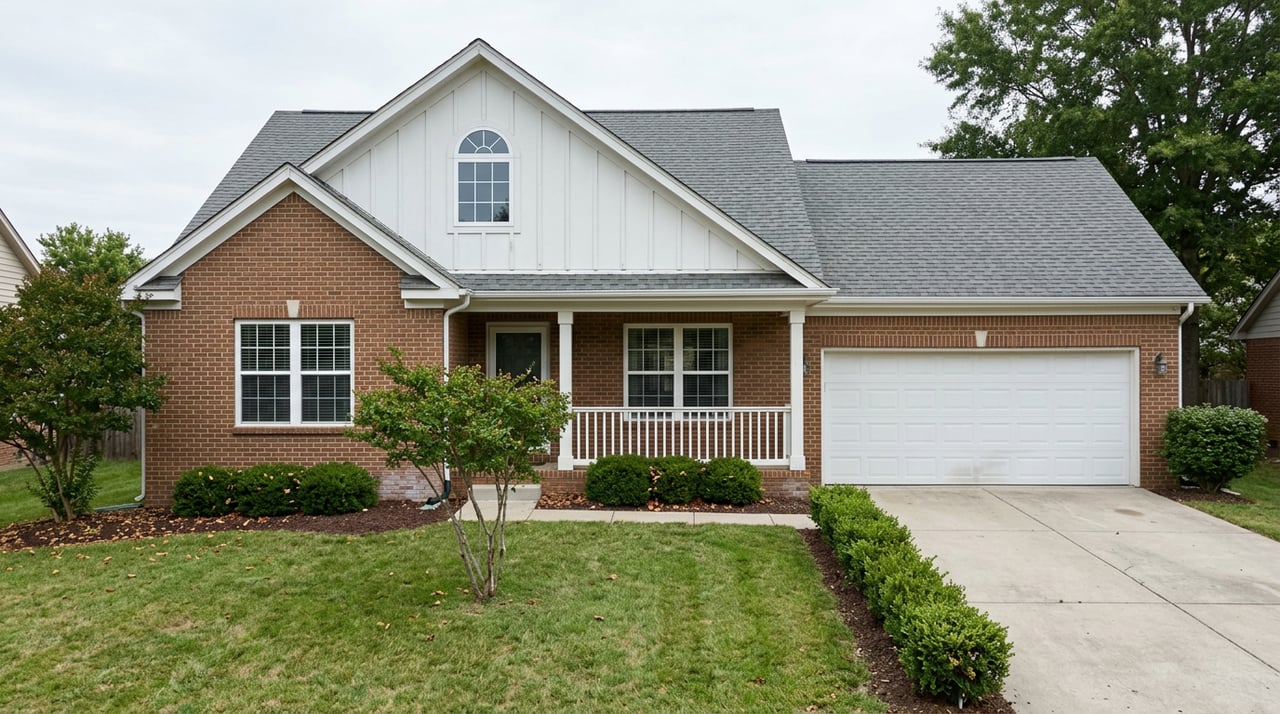
Two families each carry a pre-approval for around $350,000 into Johnston County this fall. One tours a four-bedroom on a quarter-acre lot two blocks from the Neuse River Walk in downtown Smithfield. The other tours a similarly priced new build off Flowers Plantation Road in Clayton. On paper they're spending the same money in the same county. What they're actually buying has almost nothing in common, and the gap between those two houses tells you more about where Johnston County's market is headed than the sale prices themselves do.
The Number Everyone Quotes
If you've been comparing towns on a portal, you've already seen the headline: Clayton costs more than Smithfield. As of August 2026, Smithfield's median sale price sat at $285,000, up 4.1 percent from a year earlier. Clayton's median for the same month was $349,759, up 7.7 percent year over year. That's roughly a $65,000 gap, and it's the number most comparison guides stop at.
It's the wrong number to stop at, because it tells you the two markets are diverging, not by how much you'll pay, but by what you're paying for.
What the Price Per Square Foot Figures Show
Here's the detail that doesn't show up in a median-price headline: Smithfield's price per square foot is down year over year in August 2026, while Clayton's is up year over year for the three months ending June 2026. Those different reporting periods make this a directional comparison, not a same-period snapshot.
| Metric | Smithfield | Clayton |
|---|---|---|
| Median sale price | $285,000 (Aug 2026, +4.1% YoY) | $349,759 (Aug 2026, +7.7% YoY) |
| Price per square foot | $149 (Aug 2026, down 4.2% YoY) | $200 (3 months ending June 2026, up 9.3% YoY) |
| Days on market | 91 (Aug 2026, up from 64 a year earlier) | 53 (3 months ending June 2026) |
Smithfield's August median price is up year over year while its August price per square foot is down. Clayton's August median is up year over year, and its price per square foot is up year over year for the three months ending June. These figures show different patterns, but their reporting periods differ, so they do not establish that Clayton's per-foot figure is rising faster than its median over the same period.
What Clayton's Price-Per-Foot and Median Figures Show
Clayton is absorbing new construction faster than almost anywhere else in Johnston County, and new construction carries a premium that shows up per square foot before it shows up in the median. Flowers Plantation, Clayton's largest master-planned community, keeps adding phases. The town adopted its Downtown Master Plan in September 2024, laying out a framework for denser, more walkable commercial growth. Along Veterans Parkway and the US-70 bypass corridor, the 300-acre Copper District, a mixed-use project from Craig Davis Properties, has been under construction since it broke ground in 2024, with infrastructure work, including a new elevated water tank finished in March 2026, continuing to support the buildout.
None of that shows up as a jump in the median sale price right away, because plenty of older Clayton resale homes are still trading at lower price points and dragging the median down. But every new-construction closing that comes in at $200-plus a square foot pulls the per-foot average up, while the median can move differently. If you're watching Clayton's per-square-foot number climb, you're watching new supply reprice the market from the top, one closing at a time.
Why Smithfield's Per-Foot Cost Is Falling While Its Median Rises
Smithfield's move is the mirror image, and it comes down to what kind of house is actually selling. Smithfield's median price rose 4.1 percent through August 2026, but the cost per square foot fell 4.2 percent over the same period. That combination only makes sense if the homes selling are bigger, not more expensive per foot. Older, larger homes on established downtown lots, the kind of housing stock Smithfield has in greater supply than Clayton, pull the median up simply by being bigger, even while their age and finish level keep the per-foot number from climbing with it.
There's a second wrinkle worth knowing if you're watching Smithfield's numbers month to month: it's a small enough market that a handful of sales can swing the average considerably. Smithfield's average sales price rose 7.0 percent in the first half of 2026, more than double the 2.9 percent increase across Johnston County as a whole in the same period, and that volatility is a known feature of a smaller sample size, not evidence of a market suddenly outpacing its neighbors. New construction is also finally arriving in Smithfield rather than only in Clayton. Builder activity, including a new project from Garman Homes, is set to begin construction this fall, which should give the town its first real test of whether new-build pricing moves Smithfield's per-foot number the way it's already moved Clayton's.
What This Means If You're Choosing Between the Two
If you're the buyer who wants predictable finishes, a warranty, and a home built to current code, Clayton is where that product exists today, and you should expect to keep paying a rising premium for it as more of that inventory closes. If you're the buyer who wants more square footage and more land for the same monthly payment, and you're comfortable with a home that might need a new roof before a new subdivision would, Smithfield is currently the better trade, and the falling per-foot cost means that trade is getting slightly better, not worse, as the year goes on.
There's also a timing signal buried in the days-on-market numbers. Smithfield homes are sitting for 91 days on average as of August 2026, up from 64 days a year earlier. That's not a market in trouble. It's a market where sellers no longer set the terms alone, which gives a patient buyer more room to negotiate on price, closing costs, or repairs than they'd have had a year ago. Clayton's 53-day figure covers the three months ending June 2026, rather than the August 2026 window used for Smithfield, so it is not a same-window comparison.
Smithfield's case for itself doesn't depend on winning a price-per-foot argument with Clayton. It's still the Johnston County seat, home to Johnston Health, the Ava Gardner Museum, and a downtown that fills up every May for the Ham & Yam Festival. Those are reasons people choose to live there regardless of which way the per-foot number is moving. But if you're comparing the two towns purely on what your budget buys, the direction of that number, not just its size, is the fact worth carrying into your next showing.
FAQ
Is Smithfield's falling price-per-square-foot a sign the market is weakening? Not on its own. It's a sign that the mix of homes selling has shifted toward larger, older properties. A falling per-foot number alongside a rising median usually points to what's selling, not to falling demand.
Will Clayton's new construction eventually slow down its price growth? It's reasonable to expect the per-foot premium to moderate once the current wave of subdivisions and mixed-use development, including the Copper District, reaches a more mature phase, but there's no data yet showing that slowdown has started.
Does a longer days-on-market number in Smithfield mean sellers should price lower? Not automatically. It means sellers should expect more back-and-forth on terms and should price with current comparable sales in mind rather than last year's faster-moving market.
If you're trying to figure out which side of that per-foot line makes sense for your budget and your timeline, that's exactly the kind of comparison The Thomas Parker Realty Group walks Johnston County buyers through every week. Get your free home valuation and we'll show you what your numbers actually look like on both sides of the county line.